
 ConnectStats now supports power for running with the latest version 4.1. This was an exciting few weeks for me, as I discovered the Stryd pod and started to incorporate power in my running. It was also a good opportunity to develop something new in ConnectStats.
Running Power in ConnectStats
If you have a stryd foot pod and use the Connect IQ field from stryd, after you record a run activity and download it to ConnectStats, you’ll be able to see the data in the activity field as below. You can of course see power as a graph, along with the other fields like leg stiffness and form power. 
 One of the key reason I wanted to add power to ConnectStats was to be able to graph the power curve, similar to what is available for cycling. This is one of my favorite plot in ConnectStats and show well how a given effort compare to other.
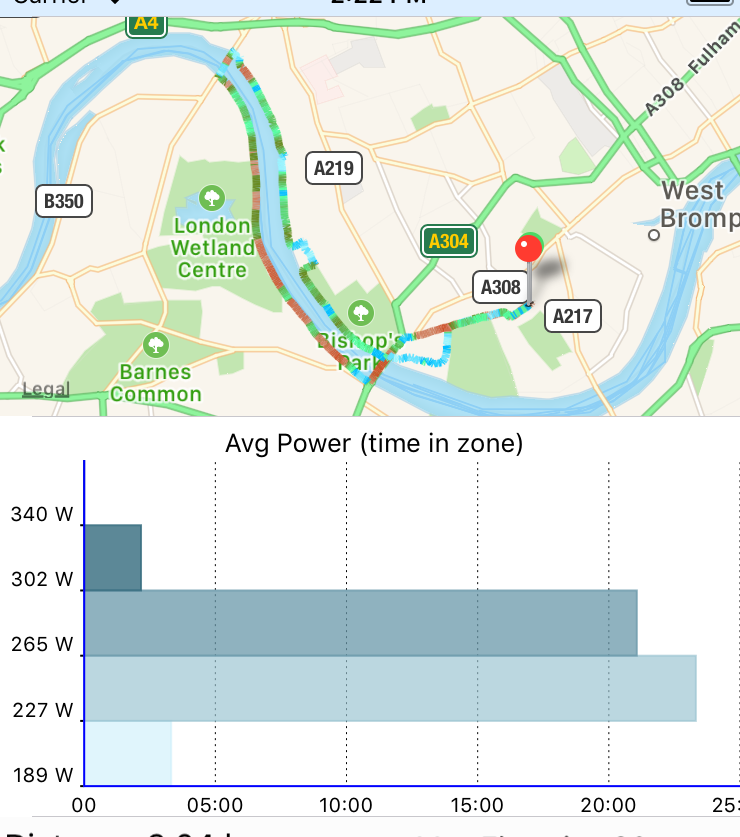
ConnectStats will of course also display other useful graph like power in zone, lap view of your power, etc, etc.
Historical View of Power
The key benefit of the power curve or rolling best power is to compare from month to month the effort. So you will see in the summary statistics along with best pace and best heart rate your best achieve curve for the month, here is my curve for February.
 I only got the stryd pod a few weeks ago, so I don’t yet have another month to compare, but to give a sense, here is what the comparison looks like for cycling

You can see here that the month of feb had higher best power achieved for longer, meaning I pushed more this month than the previous ones…
My experience with power so far
First, it came at a very good time, as you can see in my performance graph, I had been a bit lazy in my training and I was on the low side of fitness. Getting the Stryd, as any new sensor gadget/toy, provide a big motivational boost to get out and run more. The spike up of the performance graph in February clearly demonstrate that.The power while you run seems to be picking up hills or sprint effort pretty well, as this graph focusing on a hill in a lap of a run in Richmond park. I am looking forward to getting more insight and ideas how to incorporate running in my training. How leg stiffness will improve over time or form power, etc.
Please feel free to comment and suggest the types of statistics you would find useful to see with this new data, and I’ll try to incorporate in the app!
Happy power running!
Bonus for Mac users
I also updated Fit File Explorer to process third party field, so when opening a fit file with power data you can see it.

You can also do comparison between for example the data from the HRM run and the Stryd on vertical oscillation or other field recorded by both sensors
