
 While I still need to figure out how to use the new power field from Stryd, Running Power is already a useful other way to compare the type of effort of different activities. Since I got the new pod, I have been motivated to go out run more, and looking at the last few weeks, I realised that a few runs had interestingly some similar headline stats but very different feel. So I decided to see how ConnectStats displayed the differences.
In the summary, you can see the first two have very similar heart rate average, but very different pace, while the run in Shanghai has similar pace as the first one, but higher heart rate. The run in the new territories run (Hong Kong) is also interesting to compare to the Putney run (Richmond Park). Let’s dive in.
Comparing Activities in ConnectStats
You can easily compare two activities in ConnectStats by sliding the activities in the list and selecting mark. The activity will then shows in the background of the new one you look at.
A mark will be displayed to remind you which activity is the “compare” activity.

Same Heart Rate, Different Pace
The first two run to compare have an average of 176 and 175 HR respectively but a pace of 4:50 and 5:30. You can of course just look at the pace plot on top of each other, but it’s a bit messy

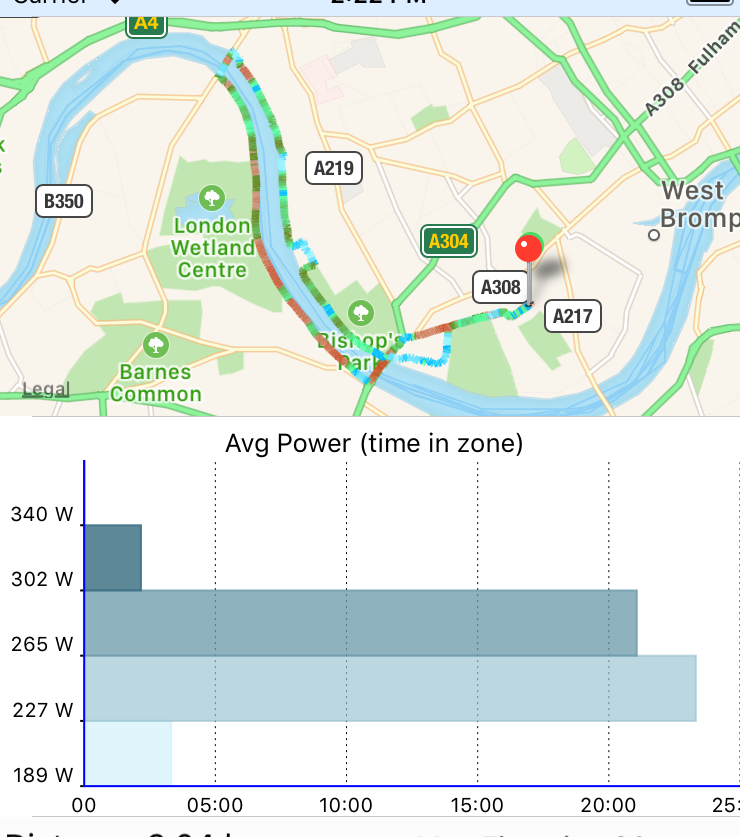
Note that the map will show you both activities, useful when they are on the same location, but less when they are quite different route, as here. The pace graph clearly shows that for large part of the run the pace was faster, but not very insightful. A much better way to compare the effort is to look at the best rolling plots.
 You can see that it was definitely a higher power effort, but the pace shows that the slower run had more constant pace, flatter curve. The heart rate plot shows that the max effort (left part of the curve) was similar, but the tail was lower (steeper curve on the right for the faster curve). Overall a less consistent effort, but where I pushed more at time and resulted in the same average heart rate but very different pace. The power curve interestingly shows quite a higher effort. These were two different runs, the slower one was a commute run, with a backpack and on city streets with more stop and go at light. It was also early morning, so typically not when I do my best performances…
Same Pace, Different Heart Rate
We can also compare that same activity to another run a week ago with same pace (4:49 and 4:50) but higher heart rate (181 and 176 respectively).
You can see the activity being compared to (lighter colour) has clearly higher heart rate effort through out. One interesting observation is that the lower heart rate run has steeper start, which means there were a few period where I pushed rather than a continuous effort . The pace on the other hand has a quite a different profile between the two runs
 The lower heart rate run has a much steeper shape, while the other one has a quite flat profile, meaning a more constant effort.
Now for the new measure of power, again interestingly the raw graph comparison is quite useless. Hard to really see much in the difference of the effort.

 But the best rolling graph again shows a very interesting story, if somewhat consistent with the other. While the effort was about the same, the higher graph shows a much more varied effort: more power on shorter time period, but converge at the end for the overall time.
The higher heart rate was just a run where I tried to push much more through out and consistently. Quite interesting that it resulted in the higher heart rate…
If you wonder why the little bump around 5min, me too! this is an annoying little bug or quirk which I haven’t yet figured out!
Time ahead
A last graph that maybe of interest, even though in this specific case, maybe less interesting in this specific case, but it shows you the time ahead (or behind) from the compared activity. The big straight drop are pauses. So you can see that I took quite a few pauses in the lower heart rate run, and it had period where I was catching up (upward slopping) and period where I was getting behind (downward slopping). On the map, the area where I am ahead are blue, and then goes to red when I am behind. Which makes it easy to see where you are behind or ahead, especially when the run is at the same place (not the case here).

Hope you found this interesting. Happy Training.


 Everything seems to be working again. ConnectStats survives another challenge and will continue its path for now. I want to thank everyone for the messages of support and positive comment on the app. It’s nice to see quite a few people still appreciate the app.
 I also want to apologise to ConnectStats users, as I have lately been extremely busy and didn’t do much new development or wasn’t very responsive to user requests. As some of you may know already, I do the app as side hobby, but have a quite busy day job. We are actually lucky, as if the outage had happened a few months ago, it would have been quite difficult for me to get the app back up and running. Beside keeping track with Garmin’s changes, a few month ago, apple made changes to its system that also broke connectstats and I was unable to push any fixes for a while. Luckily I had just resolved it a few weeks ago before the outage…


