
Table of Contents
Statistics view
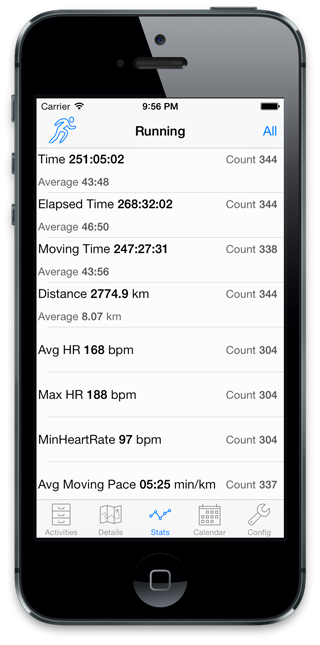
This is the page intended to let you review your whole history of activities. It first appear with a summary of all collected information for the current activity type, below as an example for Running. You can either switch the activity type on the left or using the right button rotate between, All, Monthly or Weekly view.
On ipad you access it by pressing the button ![]() on the top right of the activity list
on the top right of the activity list
You have then three choices
- tap a field in the list to study in detail the history of that measure
- use the top right button to change to weekly/monthly/year view
- choose the type of activity to study with the top left button.
Note as of version 1.19, this page has been quite redesigned, details here.
Historical Summary
The historical view will show you a summary of key statistics. You access it by selecting the field you want to study from the fields statistics view
Field History
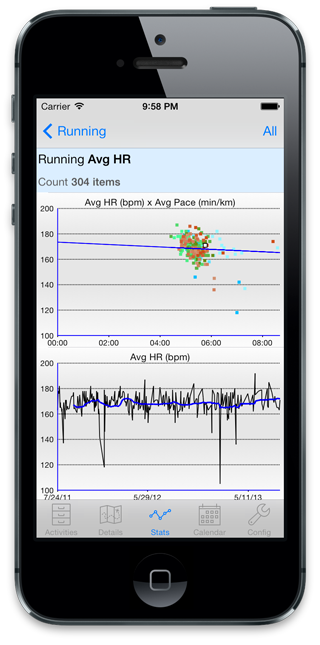
If you press a field you’ll see it’s detailed history. If you select all, you’ll see scatter plot, some statistics and a plot of all values of that field. Touch the scatter plot to see it full page and get a gear icon to rotate through different configuration of the graph. Tapping the top right button will let you see the measure aggregated by different calendar units.
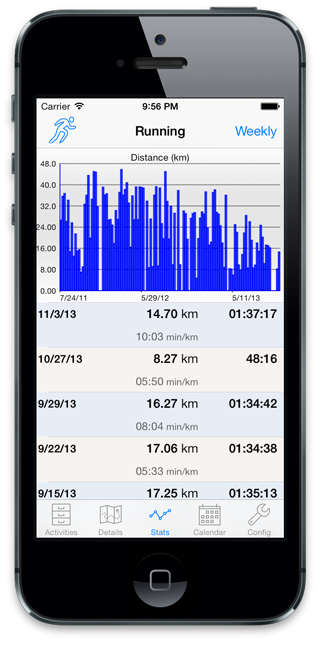
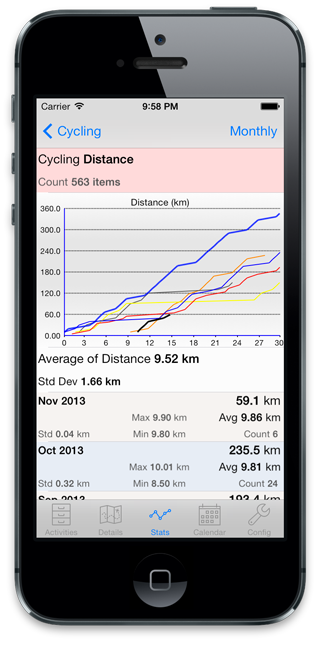
If you select monthly, weekly or yearly, you’ll get an aggregated view along with a graph either of the distribution over the chosen period or of the current cumulated value if the field can be summed. Touch that graph to access configuration options.
The distribution graph is an attempt to see the distribution of value of the units of the period. For example is your speed typically faster on monday or fridays, etc. The color coding lets you see the evolution over time, darker being the most recent. It also respect the scale of the time within the day so you can see on weekly distribution if your evening speed tends to be slower or faster than mornings.

Can you explain the “Performance Distance” graph that graphs fitness and fatigue? I just can’t figure out what you are trying to show. Please & thanks.
If you enter performance in the search box of the blog, it should show you a post that explains it. Let me know if you need more details
Hi! I’m very interested in seeing accumulated time in heart rate zones per week/month/year. Is this possible in the app? I know I can see time in heart rate zones per workout, but it would be great to also be able to view the accumulated time in each zone over a larger period of time!
Hi,
Might be unusual but I wonder if you could add a daily summary.
That would be very helpful when I like to look at my several workout per day
Hi,
I am unable to work out the pattern of taps I need to invoke to reliably bring up “… to date” statistics view i.e. week to date (WTD), month to date (MTD), etc.
If I keep tapping on the options at the top right of the screen, I sometimes get to those screens & sometimes I don’t. After almost a year it still appears random to me.
Thanks
Michael
If you do long press on the icon the most to the top right it will bring a more detailed menu. Otherwise the logic is: top most right, changes the type of screen, and other button the configuration of current screen.
Wow great App, Found it per chance. I’m using it a little different by exporting activities direct from my Wahoo-App. Wahoo currently is far away from the statistical skills of this app.
Two suggestions:
1. would be great if an activity could be deleted.
2. The app doesn’t store the last settings/screen. I would prefer the activity-screen as a start-screen and for example store the statistic-settings (month/year etc) chosen in the stat-screen.
But anyway an great App, thank you so much!
Thanks for the comments. you can only delete an activity from the source data, so if you remove it from garmin, it should not appear in connectstats.
For the last screen, yes, some of the improvement I made last year to the statistics screen will make it easier, but I haven’t been very active in development of the app recently. Will add it as a new GitHub issue
Brice, how can one choose the primary activity types in the stats section? I am skiing, have now a skiing activity and it’s included innige primary’s where I don’t want to have it, since ism only skiing once a year