

ConnectStats 6.8 comes with significant rework of the statistics and calendar page. The main new feature is the ability to compare the numbers between weeks, months or years. Let’s dive in.
First, this new feature needs to be activated by switching to the new theme 2021 in config if you haven’t already. Because it’s still has some quirks, this is not yet the default, but it’s likely within one or more release, I’ll make it the main default theme.
Difference to previous period
In the statistics page, after you reach the weekly, monthly or yearly page by tapping on the right most button “Summary” or “All”, you will now see a new calendar icon. If you tap on it it will cycle through different pages, starting from the simple statistics display for each week or month as in the previous version. But as indicated with the little rotating arrows, you will also see comparison pages. The comparison will be either a percentage change since last week or month, or the actual difference.
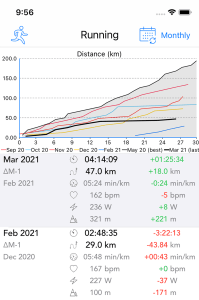


As you cycle through the view, you will also reach the comparison between period up to the same point of the current period (to date). So for example if you are half way through the month, the comparison will be against the same point (half way) of the pervious month. In the graph, you will see as an overlay the total for each month, and the icon will show a half filled month or week to indicate the fact the calculation is to the current equivalent date in the period


You can also do a long tap on the calendar icon to bring up a configuration panel which may make it quicker to go through a specific view

New Calendar View
The calendar also now shows these comparison statistics to the previous week and month.

You can tap on the statistics table to iterate through displaying the difference in percent, in value or the value of the previous period
First impression is very good new analysis!! Thanks!!
I did notice a bug: if I go to the full screen map of a run, and then tap the label icon from pace to hR to power etc, the colour coding of the run on the map does not change anymore.
If I’m not in full screen mode but swipe between graphs then the colour coding of the map changes as intended
Thanks for this. About the bug, you’re right, I will fix. Tracker: https://github.com/roznet/connectstats/issues/89
Hi there is only one thing I want from an app like this and neither the garment connect app nor this provide yet it is so simple and it’s one of the only things the Tomtom app provides so well. That is a graph of time vs speed. You do provide the pace graph but it’s inverted so quicker is smaller and you also cannot alter the scale so it really doesn’t make sense to read it like that. Please see the Tomtom graphs for how this should be.
Hello,
Since version 6.8, the total monthly distance on the calendar is not displayed.
Please let me know the solution.
Thank you
Hi Brice,
As always, thx so much to keep working on ConnectStats! Switched to the new theme, very nice! One thing though: any chance to get the cumulative line graph back for all activities, e.g. for calories or elevation gain? It’s there in the preview, but when tapping on it, I seem only to be able to configure scatter plots and bar graphs now. Honestly, I never look at the scatter plots since it’s pretty obvious how e.g. calories vs distance scatters 😜
Looking at how my calorie consumption year-to-date for all activities grows is IMHO very helpful though, I consider this a direct measure of my training status so far. Similar for elevation gain…
Thx!
Is also the version for Android available? Thank you.